Reproducible Research
Cognitive psychology and cognitive neuroscience rely on complex experimental designs, sophisticated statistical analyses, and often large volumes of data from behavioral, neuroimaging, or electrophysiological measures.
When researchers share their data, code, and analysis steps in a way that others can see and repeat, it allows people to double-check the results and catch any mistakes, whether accidental or not.
Reproducibility also supports the idea that science builds on previous work. In cognitive neuroscience we test new ideas based on earlier studies about how the brain supports thinking and behavior. If earlier findings can’t be reproduced, it becomes harder to know whether newer studies are on solid ground.
Reproducibility also makes it easier to see how researchers made their choices about data cleaning, analysis methods, or statistical models—which matters a lot, since small changes in how the data are handled can lead to different outcomes. This is especially true in high-dimensional data contexts such as EEG, fMRI, or large-scale behavioral experiments.
Lately, there has been growing concern about whether psychology research can be reliably repeated; Making research reproducible helps address this problem and rebuild confidence in the results. It lets other scientists, reviewers, and readers clearly understand how the research was done, from collecting data to interpreting the findings.
In cognitive psychology and cognitive neuroscience, where researchers often look for subtle effects in complex data, reproducibility isn’t just a good idea—it’s necessary for making real progress.
Automation of Data Collection, Processing and Analysis
Automating data collection, processing, and analysis via scripts is crucial for data integrity and research reproducibility for several key reasons:
Reduces Human Error: Manual data handling is prone to mistakes—copy-paste errors, incorrect calculations, or mislabeling variables. Scripts execute the same operations consistently every time, ensuring accuracy.
Enables Reproducibility: Using scripts creates a transparent record of every step in the research pipeline. Anyone can rerun the exact process on the same or updated data and obtain the same results—an essential condition for reproducible research.
Supports Version Control: Scripts can be tracked and versioned using tools like Git. This allows researchers to document changes over time, revert to earlier versions if needed, and collaborate more effectively without ambiguity about what was done.
Facilitates Scalability: Once a script is written, it can be easily reused or adapted for larger datasets or similar studies. This is far more efficient than repeating manual steps each time.
Improves Transparency: Well-documented code makes the data workflow clear to others (e.g., peer reviewers or collaborators). This transparency strengthens trust in the methods and results.
Simplifies Error Checking and Debugging: When results seem off, you can trace through a script to find and fix problems. That’s much harder with undocumented manual steps or ad hoc procedures.
Encourages Good Documentation and Workflow Discipline: Script-based workflows typically require researchers to think carefully about data structure, naming conventions, and processing logic—all of which contribute to better data hygiene.
Enables Automation of Quality Checks: Scripts can be designed to automatically flag missing values, outliers, or formatting issues, thereby maintaining high standards of data integrity throughout the project.
In short, automating your workflow through scripting isn’t just a convenience—it’s a foundational practice for producing rigorous, trustworthy, and repeatable research.
Why R and R Markdown are GREAT for reproducible research
 |
R used along with the RStudio IDE is powerful tools for reproducible research because is a scripting language, which means every step of your data analysis—from loading the data to producing final plots or statistical tests—is written explicitly in code. This allows for:
Full transparency: Anyone can see exactly what was done, line by line.
Reproducibility: You (or others) can rerun the same script on the same data and get the same results.
Automation: R can handle large or complex datasets efficiently, apply the same operations across multiple files, and integrate data cleaning, analysis, and visualization in one workflow.
Version control: R scripts work well with tools like Git, so you can track changes over time and collaborate more easily.
Integration with reports: R Markdown allows researchers to combine narrative text, code, and output in a single dynamic document that updates automatically when the data or analysis changes.
This approach, called literate programming, means that things like tables, graphs, and statistical results are created automatically when the document is compiled. That way, the results shown in the final report always match the code that produced them.

Another helpful feature is how easily the document updates. If you make changes to your data, your analysis method, or your model settings, you can simply re-knit the document, and all the results, graphs, and numbers will update automatically. This saves time and helps prevent mistakes that can happen when copying and pasting results by hand.
Overall, R and R Markdown help unify your analysis and your report, reduce errors, make your work more transparent and easier to repeat, and simplify collaboration and sharing. It is a modern day lab notebook.
These features make R and R Markdown essential tools for doing modern, reproducible research.
Git 
Version control systems like Git play a crucial role in reproducible research by helping researchers track, manage, and share changes to their code, data, and documentation over time.
In the context of reproducible research, Git provides a reliable way to record the full history of a project, making it easier to understand how analyses evolved and to return to earlier versions if needed.
One of Git’s key benefits is that it allows you to document every change made to a file—what was changed, when, and by whom. This helps ensure transparency and accountability, especially in collaborative projects where multiple people are working on the same materials. If a result changes, you can easily trace it back to a specific update in the code or data.
Git also enables branching and experimentation. Researchers can try out new methods or alternative analyses in a separate branch of the project without affecting the main version. If the new approach works, it can be merged back in; if not, it can be discarded—without losing any work or breaking the original workflow.
When paired with hosting platforms like GitHub or GitLab, Git makes it easy to share code and materials publicly, enhancing reproducibility and openness. Others can download the entire history of a project, reproduce the exact analyses, and contribute improvements or corrections.
Finally, Git supports integration with tools like R Markdown and Jupyter Notebooks, which combine code, narrative, and output. When these documents are version controlled, the entire research pipeline—from data input to final report—is preserved and reproducible.
In short, Git helps maintain a clear, detailed, and sharable record of the research process, which is essential for verifying results, collaborating effectively, and building trustworthy science.
Why SPSS is not good for reproducibility
![]()
SPSS is not well suited for reproducible research because it separates the statistical analysis from the reporting and does not naturally support a transparent, script-based workflow.
SPSS is primarily a graphical user interface (GUI)-based tool. While it offers some scripting (via syntax files or Python integration), most users rely on point-and-click operations. This creates several problems:
Poor transparency: It’s difficult to see or remember exactly what sequence of steps was taken unless you manually save syntax for every action.
Low reproducibility: Reproducing an analysis requires repeating each click in the correct order, which is error-prone and hard to document.
Limited automation: Batch processing or applying the same analysis across many datasets is cumbersome compared to R.
Weak version tracking: SPSS does not naturally integrate with version control systems, making it harder to document and share changes to analysis procedures.
In short, while SPSS is user-friendly and widely used, especially in the social sciences, it does not support the kind of transparent, flexible, and automated workflow that is essential for modern reproducible research.
Reproducible research pipeline
Here is a detailed end-to-end account of a fully reproducible research pipeline from experiment generation to manuscript submission:
Experiment Generation
Tools: OpenSesame or PsychoPy
These tools allow you to build precise, scriptable cognitive paradigms for visual/auditory language processing experiments.
Use inline scripts (Python in OpenSesame or directly in PsychoPy) to define experimental logic, stimulus presentation, and response logging.
Store your experimental script, all stimuli (text, image, audio), and configuration files in a version-controlled folder (see GitHub section below).
Save stimuli lists, condition files, and log output in standard formats (
.csvor.tsv).
Tip: Clearly comment code and parameter settings (e.g., SOAs, trial timings, stimulus mappings) so that the experiment is easy to rerun or audit.
Data Collection
Tool: BrainVision Recorder
Data are recorded in
.eeg,.vhdr, and.vmrkformats.Store raw data in a well-structured folder system (e.g.,
raw_data/SUBJID/task/), with naming conventions that includesubject ID,task ID, anddate.Archive experiment logs alongside EEG data to cross-check timing and accuracy.
Tip: Keep a “README” file in each subject folder that documents session notes (e.g., issues during recording, impedance levels, etc.).
Data Preprocessing and ERP Analysis
Tools: EEGLAB and ERPLAB in MATLAB
Create a MATLAB script that automates the full pipeline:
Importing raw BrainVision files using
pop_loadbv()Resampling, filtering, and bad channel interpolation
Re-referencing, channel location setup
Event list generation, binning via
binlister()Epoching, baseline correction, artifact rejection
ERP averaging via
pop_averager()and saving.erpfilesSave intermediate and final outputs in a structured
processed_data/folder.All preprocessing scripts should be fully reproducible and version-controlled.
Tip: Write a separate QC script that automatically checks for missing triggers, high artifact rejection rates, or bad channels.
Statistical Analysis
Tools: R + R Markdown
Import ERP measurement tables (e.g., amplitude/latency by condition and subject) into R.
Conduct your statistical modeling (e.g., repeated-measures ANOVA, mixed-effects models) using
tidyversepackages andafexorlme4.Use
ggplot2to create publication-quality plots.Document your entire analysis workflow in an R Markdown document:
Combine code, output, and interpretation
Export to PDF or Word for internal reports
Tip: Store the cleaned datasets and analysis script separately from raw inputs to preserve data integrity.
Manuscript Writing
Tool: LaTeX
Use Overleaf or local LaTeX with a proper folder structure:
main.tex,figures/,tables/,bib/Generate figures in R, export as
.pdfor.eps, and include them with\includegraphics{}.Automate table generation using R and export as LaTeX-formatted output (e.g., with
xtableorkableExtra).
Tip: Consider using arxiv.sty or the journal’s class file early to avoid layout issues during submission.
Version Control
Initialize a Git repo at the root of your project.
Structure it as follows:
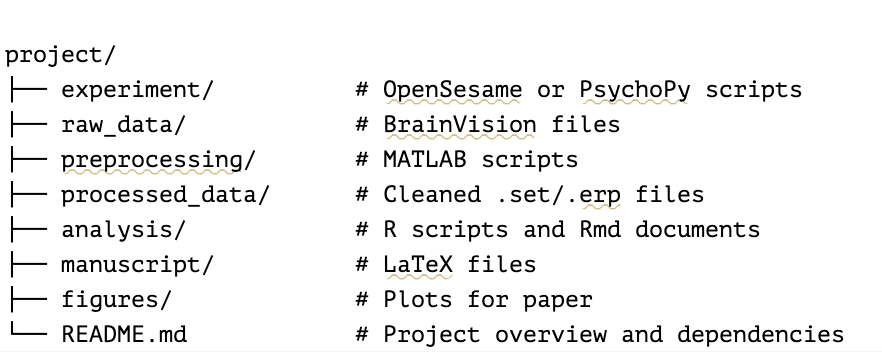
Commit regularly and use meaningful messages (e.g., “added artifact rejection step”, “updated ANOVA with 3-way interaction”).
Use branches for major changes and tag commits for milestones (e.g., “pre-submission”).
Share your repo (privately or publicly) with collaborators or reviewers, and include a
reproducibility.Rmdorrun_pipeline.shthat walks others through your workflow.
Tip: Add .gitignore to exclude large raw files or auto-generated outputs from version control.
Optional: Archiving and Pre-registration
Pre-register your hypotheses and methods via the Open Science Framework (OSF) or AsPredicted.
Use Zenodo to create a DOI for your GitHub repository, making it citable.
Archive data and code with appropriate de-identification and documentation in formats like BIDS-EEG where possible.
Final Thoughts
This kind of scripted, modular, version-controlled workflow ensures that:
Anyone can reproduce your analyses from raw data.
You maintain data integrity throughout each transformation.
Collaborators can easily understand and reuse your work.
You’re prepared for peer review, data sharing, and long-term archiving.